Delay differential equations in Python

I wrote a very simple and user-friendly method, that I called ddeint, to solve delay differential equations (DDEs) in Python, using the ODE solving capabilities of the Python package Scipy. As usual the code is available at the end of the post :).

Example 1 : Sine

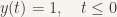
I start with an example whose exact solution is known so that I can check that the algorithm works as expected. We consider the following equation:

y(t) = sin(t) \ \ \ for\ \ \ t < 0

y'(t) = y(t-3\pi/2) \ \ \ for\ \ \ t \geq 0

The trick here is that sin(t-3\pi/2) = cos(t)=sin'(t) so the exact solution of this equation is actually the sine function.

from pylab import *

model = lambda Y,t : Y(t - 3*pi/2) # Model
tt = linspace(0,50,10000) # Time start, end, and number of points/steps
g=sin # Expression of Y(t) before the integration interval 
yy = ddeint(model,g,tt) # Solving

# PLOTTING
fig,ax=subplots(1)
ax.plot(tt,yy,c='r',label="$y(t)$")
ax.plot(tt,sin(tt),c='b',label="$sin(t)$")
ax.set_ylim(ymax=2) # make room for the legend
ax.legend()
show()

dde_sin

The resulting plot compares our solution (red) with the exact solution (blue). See how our result eventually detaches itself from the actual solution as a consequence of many successive approximations ? As DDEs tend to create chaotic behaviors, you can expect the error to explode very fast. As I am no DDE expert, I would recommend checking for convergence in all cases, i.e. increasing the time resolution and see how it affects the result. Keep in mind that the past values of Y(t) are computed by interpolating the values of Y found at the previous integration points, so the more points you ask for, the more precise your result.

Example 2 : Delayed negative feedback

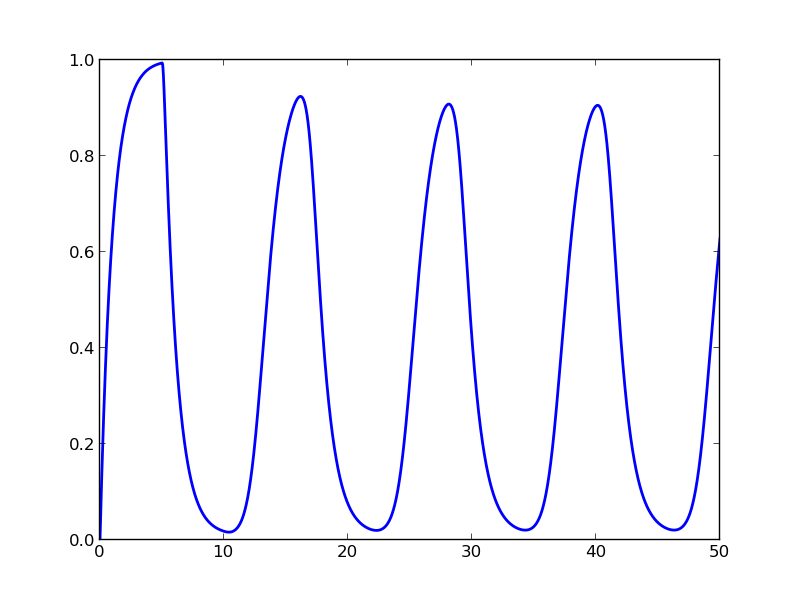
You can select the parameters of your model at integration time, like in Scipy’s ODE and odeint. As an example, imagine a product with degradation rate r, and whose production rate is negatively linked to the quantity of this same product at the time (t-d):

y(t) = 0 \ \ \ for\ \ \ t < 0

y'(t) = \dfrac{1}{1+(\dfrac{y(t-d)}{K})^2} -ry(t) \ \ \ for\ \ \ t \geq 0

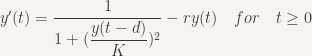
We have three parameters that we can choose freely. For K = 0.1, d = 5, r = 1, we obtain oscillations !

from pylab import *

# MODEL, WITH UNKNOWN PARAMETERS
model = lambda Y,t,k,d,r :  1/(1+(Y(t-d)/k)**2) - r*Y(t)

# HISTORY
g = lambda t:0 

# SOLVING
tt = linspace(0,50,10000)
yy = ddeint(model,g,tt,fargs=( 0.1 , 5 , 1 )) # K = 0.1, d = 5, r = 1

# PLOTTING
fig,ax=subplots(1)
ax.plot(tt,yy,lw=2)
show()

dde_negativefeedback

Example 3 : Lotka-Volterra system with delay

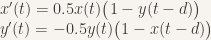
The variable Y can be a vector, which means that you can solve DDE systems of several variables. Here is a version of the famous Lotka-Volterra two-variables system, where we introduce some delay d. For d=0 we find the solution of a classical Lotka-Volterra system, and for d non-nul, the system undergoes an important amplification:

\big(x(t), y(t)\big) = (1,2) \ \ \ for\ \ t < 0, \ \ else

x'(t) = 0.5x(t)\big(1-y(t-d)\big)\\   y'(t) = -0.5y(t)\big(1-x(t-d)\big)

from pylab import *

def model(Y,t,d):
    x,y = Y(t)
    xd,yd = Y(t-d)
    return array([0.5*x*(1-yd), -0.5*y*(1-xd)])

g = lambda t : array([1,2])
tt = linspace(2,30,20000)
fig,ax=subplots(1)

for d in [0, 0.2]:
    yy = ddeint(model,g,tt,fargs=(d,))
    # WE PLOT X AGAINST Y
    ax.plot(yy[:,0],yy[:,1],lw=2,label='delay = %.01f'%d)

ax.legend()
show()

dde_lotka

Example 4 : A DDE with varying delay

This time the delay depends on the value of Y(t) !

y(t) = 1,\ \ \ t \leq 0

y'(t) = - y\big(t-3\cos(y(t))^2 \big),\ \ \ t > 0

from pylab import *
model = lambda Y,t:  -Y(t-3*cos(Y(t))**2)
tt = linspace(0,30,2000)
yy = ddeint(model, lambda t:1, tt)
fig,ax=subplots(1)
ax.plot(tt,yy,lw=2)
show()

dde_Ydependent

Code

Explanations

The code is written on top of Scipy’s ‘ode’ (ordinary differential equation) class, which accepts differential equations under the form

model(Y,t) = ” expression of Y'(t) ”

where Y, and the output Y', must be Numpy arrays (i.e. vectors).

For our needs, we need the input Y to be a function of time, more precisely a function that can compute Y(t) at any past or present t using the values of Y already computed. We also need Y(t) to return the value of some function g(t) if t is inferior to some time tc that marks the start of the integration.

To this end, I first implemented a class (ddeVar) of variables/functions which can be called at any time t: for $t<latex t_c$, it will return the value of g(t), and for t>tc, it will look for two already computed values Y_a and Y_b at times t_a<t<t_b, from which it will deduce Y(t) using a linear interpolation. Scipy offers many other kinds of interpolation, but these will be slower and won't support vectors for Y.

Such variables need to be updated every time a new value of Y(t) is computed, so I created a class 'dde' that inherits from Scipy's 'ode' class but overwrites its integration method so that our special function Y is updated after each integration step. Since 'ode' would feed the model with a vector Y (a Numpy array to be precise), which we don't want, we give to the integrator an interface function that takes a Numpy array Y as an argument, but immediately dumps it and calls the model with our special ddeVar variable Y (I hope that was clear 🙂 ).

Ok, here you are for the code

You will find the code and all the examples as an IPython notebook HERE (if you are a scientific pythonist and you don’t know about the IPython notebook, you are really missing something !). Just change the extension to .ipynb to be able to open it. In case you just asked for the code:

# REQUIRES PACKAGES Numpy AND Scipy INSTALLED
import numpy as np
import scipy.integrate
import scipy.interpolate
 
class ddeVar:
    """ special function-like variables for the integration of DDEs """
    
    
    def __init__(self,g,tc=0):
        """ g(t) = expression of Y(t) for t<tc """
        
        self.g = g
        self.tc= tc
        # We must fill the interpolator with 2 points minimum
        self.itpr = scipy.interpolate.interp1d(
            np.array([tc-1,tc]), # X
            np.array([self.g(tc),self.g(tc)]).T, # Y
            kind='linear', bounds_error=False,
            fill_value = self.g(tc))
            
            
    def update(self,t,Y):
        """ Add one new (ti,yi) to the interpolator """
        
        self.itpr.x = np.hstack([self.itpr.x, [t]])
        Y2 = Y if (Y.size==1) else np.array([Y]).T
        self.itpr.y = np.hstack([self.itpr.y, Y2])
        self.itpr.fill_value = Y
        
        
    def __call__(self,t=0):
        """ Y(t) will return the instance's value at time t """
        
        return (self.g(t) if (t<=self.tc) else self.itpr(t))


class dde(scipy.integrate.ode):
    """ Overwrites a few functions of scipy.integrate.ode"""
    
    
    def __init__(self,f,jac=None):
		
        def f2(t,y,args):
            return f(self.Y,t,*args)
        scipy.integrate.ode.__init__(self,f2,jac)
        self.set_f_params(None)
        
 
    def integrate(self, t, step=0, relax=0):
		
        scipy.integrate.ode.integrate(self,t,step,relax)
        self.Y.update(self.t,self.y)
        return self.y
        
 
    def set_initial_value(self,Y):
		
        self.Y = Y #!!! Y will be modified during integration
        scipy.integrate.ode.set_initial_value(self, Y(Y.tc), Y.tc)


def ddeint(func,g,tt,fargs=None):
    """ similar to scipy.integrate.odeint. Solves the DDE system
        defined by func at the times tt with 'history function' g
        and potential additional arguments for the model, fargs
    """
    
    dde_ = dde(func)
    dde_.set_initial_value(ddeVar(g,tt[0]))
    dde_.set_f_params(fargs if fargs else [])
    return np.array([g(tt[0])]+[dde_.integrate(dde_.t + dt)
                                 for dt in np.diff(tt)])

Other implementations

If you need a faster or more reliable implementation, have a look at the packages pyDDE and pydelay, which seem both very serious but are less friendly in their syntax.

Finding a subnetwork with a given topology in E. Coli

A few weeks ago I posted about how easy it was, using Python’s Networkx module and the RegulonDB database, to get and navigate through the genetic network of E. Coli. I didn’t mention at the time that you can also find all the subnetworks of E. Coli sharing a given topology with just a few lines of code:

import networkx.algorithms.isomorphism as iso
def find_pattern(graph,pattern,sign_sensitive = True):

    if sign_sensitive:
        edge_match = lambda e1,e2 : (e1['sign']==e2['sign'])
    else:
        edge_match = None
    matcher = iso.DiGraphMatcher(graph,pattern,edge_match=edge_match)
    return list(matcher.subgraph_isomorphisms())

Feedforward loops in E. coli

As an example, let us have a look at the feedforward loops in E. coli. A feedforward loop can be described as a gene having an action on another gene, both directly and through the intermediary of another gene, like in the following sketch, where the arrows can represent activations or repressions

A feedforward !

If you want to print all the feedforward loops in E. coli’s network (as represented by RegulonDB), try this :

import networkx as nx
feedforward = nx.DiGraph()
feedforward.add_edges_from([('A','I'),('I','C'),('A','C')])
ffwd_in_ecoli = find_pattern(ECN,feedforward,sign_sensitive=False)
for subgraph in ffwd_in_ecoli:
    print subgraph

This prints each feedforward loop with the respective roles of the different genes (A,I, or C). As you can see there are 63 feedforward loops in regulonDB’s network, which is many. Let us now get sign-specific :

import itertools as itt
labels = []
frequencies = []
for signs in itt.product(('+','-'),repeat = 3):

    ffwd = nx.DiGraph()
    ffwd.add_edges_from([('A','I',{'sign':signs[0]}),
                         ('I','B',{'sign':signs[1]}),
                         ('A','B',{'sign':signs[2]})])
    frequency = len(list(find_pattern(ECN,ffwd,True)))
    frequencies.append(frequency)
    labels.append(" ".join(signs))

frequencies = array([float(f) for f in frequencies])/sum(frequencies)
fig,ax = subplots(1, figsize=(5,5))
title('feedforward loops in E. coli, \n by signs of A->I,I->B,A->B')
pie(frequencies, labels=labels, autopct='%1.1f%%', shadow=True)
show()

Relative frequencies of the different feedforward loops in E. coli

I’m not the first one to do such reasearch, but that won’t prevent me from commenting 🙂 The most frequent pattern can be seen as a double repression : gene A represses gene B, and, as an additional punishment, also represses the activator I of B. Such feedforwards are called coherent, as the two actions of the gene A have the same effect on the gene B. The second most frequent feedforward is incoherent: gene A activates gene B while activating a repressor of B, which seems a little foolish, but can be a way of creating bumps of activity (B is awaken just a few minutes before its repressor puts it down again).

A word of caution

Note that the algorithm didn’t find any feedforward loop with activations only (+++), while some have been reported in the literature. The same way, I couldn’t find any mutual interaction between two genes (A has an action on B and B has an action on A). So if you are going to use regulonDB’s network of interactions for reasearch purposes, always have in mind :

  • The database is INCOMPLETE, meaning that you can use it (carefully) to deduce the existence of stuff, but not to prove the absence of something. In particular, many gene interactions that occur through the intermediary of metabolites are omited ! For instance, the gene cyaA produces the cyclic AMP that is necessary to activate the genes regulated by crp. However only crp appears as a regulator of these genes.
  • In the context of synthetic biology, the few genes added to the bacteria are often supposed to work independently of the rest of the bacteria (some biologists say that they are orthogonal to the rest of the system). Thus, if you design a feedforward loop, it will be a feedforward loop and nothing else. But keep in mind that when the pattern-matching algorithm finds a feedforward loop in E. coli’s networks, each gene of the triangle could also be under the influence of many other, and maybe the behavior of the circuit is not what could be inferred by looking only at these three genes.
  • The algorithm consider isomorphism between subnetworks, which implies that it won’t mind if the subnetwork is under the influence of external genes, but it will mind if the subnetwork has auto-regulations that do not appear on the provided pattern. For instance, fis regulates crp and vice-versa, but this won’t be reported if you simply look for the pattern A\leftrightarrow B because, in addition, fis and crp regulate themselves !